• Home
  • About
  • Ways to Contact: 480-463-4062

A Griffith Listing

Real Estate Services by Jon Griffith

You are here: Home / Archives for Market Updates

Market Snapshot, April 11, 2022

April 11, 2022 by Jon Griffith

Here are some facts about today’s real estate market:

We are and have been in a seller’s market since 2014.  There are currently 4,231 active homes for sale in the entire Arizona Regional MLS system.  There are 749 homes that are listed as “coming soon” which are not technically Active in the MLS.  9,764 homes are under contract.  6,984 homes were listed in the past 30 days.

The average list price for single family detached (SFD) homes in the valley is $697,446.  

Of all of the SFD homes that have sold, the average sale price is $626,214 and as an average, homes are closing at 102% of asking price.

If we reduce our sampling of sold properties to only the sweet spot, which is 3 Bedroom/2 Bath, then we have a total of 2,146 sold SFD homes in the past 30 days with an average sale price of $466,060 at an average 103% of asking price.

On average, we are seeing only 24 days from the time these homes hit the market to the time they close escrow.  A typical conventional sale takes approximately 30 days, although some lenders can close faster than that.  When a home closes quickly, it’s usually due to terms that are favorable to the seller.  Some of these favorable conditions include buyers who are investors with cash who can close quickly with no contingencies, appraisals, repairs, etc.  Some of these buyers are not just small investors, but large firms who are snatching up properties as investments.

When buyers are buying solely as a financial investment, you can rest assured that they’re not terribly concerned about the emotional investment, which makes it very difficult for the average home buyer who actually needs a home to find a home, because that investor can financially outperform the average buyer and offer much more favorable terms to the sellers.

Even if the price seems too high on a property, as is the case in these times, there’s going to be someone who is willing to pay more than you even if it means they might take a loss on the property.  It doesn’t make much sense, but it happens, and as long as the supply is short and demand is high, upward pressure will continue.

Offers that are less than asking price based upon the current conditions and historical data, regardless of one’s opinion of price, will likely be rejected.

Filed Under: Market Updates

Protected: Market Summary for the Beginning of 2016

January 6, 2016 by Jon Griffith

This content is password protected. To view it please enter your password below:

Filed Under: Market Updates, Uncategorized Tagged With: Active Listings, Greater Phoenix, market, TRID

August Market Wrap Up

September 1, 2008 by admin

August 2008, a mere 3 years since the height of our most recent over-inflated boom, has come to a close.

In August, we saw 5833 properties sell at an average sales price of $254,920. The average asking price on properties that sold in August was $245,818 and it took an average of 113 days for those to sell. Homes currently on the market have been so for approximately 94 days on average.

In the Rental market, we currently see a total of 8,905 properties available for lease. In August, 2030 properties were leased at an average rental asking price of roughly $1300/month.

We currently have 51,807 active listings on the MLS with 42,479 of those being Single Family Detached.  Last Monday, this number was at 43,705, representing a 2.8% decrease in the number of homes on the market.

The average sales price for the week ending 8/31/08 was up 14.79% to $280,430 and the number of homes sold in this same period almost doubled to 2110.  Keep in mind that statistics and business that we see recorded today is a result of market conditions and activity in the past.  That is what makes forecasting so difficult.  We never know what the future results of our current actions will be.

It’s taking about 109 days to sell a home across the MLS.  The average asking price fell slightly from the previous week to $408,001.

Filed Under: Market Updates Tagged With: asking, August, average, features, forecasting, market, price, Rental, statistics, Wrap

Will We Hit 2003 Pricing?

August 23, 2008 by admin

Sampling of a North Phoenix neighborhood sales history.

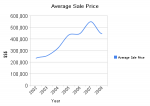
It’s hard to say whether or not our market is continuing to correct. I have updated my Market Statistics page this evening and as you can see from the graph below, we are at 2004 pricing. Draw a line from 2001 to our current average sales price today and you’ll see that we’re where we should be. The unrealistic gains are still falling off in certain market areas and people who sell now are still profiting, albeit not nearly as much as they could have.

If you’ll recall, everyone kept saying, “where would you go,” when asked if they should sell back in 2005. Not many people saw that we’d fall back to where we were in 2004. My question for the masses is whether or not we’re going to see an over correction, pushing prices into the 2003 range.

Filed Under: Market Buzz, Market Updates Tagged With: correction, history, market, Market Statistics, price, pricing, Sampling, unrealistic

Interpreting Statistics: Sold Price vs. Asking Price

August 20, 2008 by admin

Know what the statistics represent before making a decision.

Statistics help us know what happened so we might prepare for what could happen based on the patterns we’ve observed.  It is very easy to manipulate statistics to show results that will help us gain your trust and confidence.  One of the statistics that I’ve been looking at in the Valley is the percentage of sold price versus asking price.

When a home receives an offer, those of us who think statistically and mathematically will quickly determine what the percentage of the asking price the offer represents.  On a home that is listed for $300,000, if someone offers $285,000 they have submitted a 95% offer.  This information can be very useful for the buyer to determine what to offer the seller.  If the buyer were to look at this from the percentage angle as opposed to the dollar amount, and they were willing to put in a 90% offer, we’d know that their offer is going to be $270,000.  What the seller does at this point is up to the seller, but that’s not the point of this article.

With thousands of sales every month, it is becoming easier for us to compare your property to the rest of the market.  One of the comparisons we look at is the sold price to asking price, which helps our sellers understand what to expect when they receive an offer.  What has often been overlooked is the percentage result we obtain by determining the sold price versus the original asking price.  Most reports that we run are defaulted to show the list price at the time of sale, not the list price at the time the property was listed.

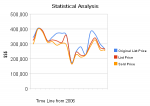
I conducted a simple comparison on 16 properties of a subdivision in the west valley that were all comparable properties.  In order to obtain enough results, I had to go back two years.  I compared the sold to list price of each property and then averaged the results.  What it showed was that on average, the properties that were selling in that neighborhood were selling for approximately 95.6% of their list price.

After calculating the percentage based on the original list price, which is the price for which the seller originally wanted to list their home,  the results showed that the sold price was actually  88.8% of the original list price.

Without conducting your own statistical analysis, it is difficult to understand what someone might be attempting to show you if they don’t disclose how they came up with their numbers.  On one hand, you could pitch to your buyer that it’s likely the seller will settle upon a price that is around 95% of the asking price.  Likewise, you could show a potential seller that their asking price is far too high and that they could expect on average to settle for 88% of their original asking price.

Make sure you know when you are presented with statistics what those statistics are actually measuring, and which statistics really matter to you.

Filed Under: Market Updates Tagged With: asking, comparison, Interpreting, offer, percentage, price, seller

Market Update as of August 18th

August 18, 2008 by admin

As of the beginning of the week we had a total of 54,674 homes for sale, including all residential property types. By the end of the day on Sunday, our levels had dropped 1.6% to 53,767. The average asking price at the beginning of the week was $408,161 which increased less than one percent. Average days on market decreased by 5.1%.

1256 properties were sold over the past week which was 18.6% more than was sold the previous week. Word is getting out. It’s time to buy.

For properties that sold last week, the average asking price actually increased 2.83% over the previous from $241,098 to $247,941. The actual average SOLD price of the 1256 properties that sold last week was $237,968, 1.4% less than the previous week at $241,268. Those properties on average were on the market 116 days.

Filed Under: Market Updates Tagged With: asking, August, average, market, price, property, Recently Sold, Update

  • 1
  • 2
  • Next Page »

Archives

  • September 2023
  • April 2022
  • March 2016
  • January 2016
  • December 2015
  • October 2015
  • June 2015
  • May 2015
  • April 2015
  • February 2015
  • January 2015
  • July 2014
  • April 2014
  • March 2014
  • November 2013
  • October 2013
  • September 2013
  • August 2013
  • May 2013
  • March 2013
  • February 2013
  • July 2012
  • March 2012
  • December 2011
  • December 2010
  • April 2010
  • March 2010
  • February 2010
  • January 2010
  • December 2009
  • November 2009
  • September 2009
  • August 2009
  • June 2009
  • April 2009
  • March 2009
  • February 2009
  • January 2009
  • December 2008
  • November 2008
  • October 2008
  • September 2008
  • August 2008
  • July 2008
  • June 2008
  • May 2008
  • April 2008
  • March 2008
  • February 2008
  • January 2008
  • December 2007
  • November 2007
  • October 2007
  • September 2007
  • August 2007
  • July 2007
  • April 2007
  • March 2007
  • November 2006
  • August 2006
  • June 2006
  • September 2005
  • August 2005

Test

  • About
  • Affordability Calculator
  • Arizona Department of Real Estate Buyer Advisory
    • Additional Information
    • Common Documents a Buyer Should Review
      • Affidavit of Disclosure
      • County Assessors/Tax Records
      • Covenants, Conditions and Restrictions (“CC&R’s”)
      • HOA Disclosures
      • Home Warranty Policy
      • Homeowner’s Association (“HOA”) Governing Documents
      • Lead Based Paint Addendum
      • Loan Documents
      • MLS Printout
      • Professional Home Inspection Report
      • Purchase Contract
      • Seller’s Property Disclosure Statement (“SPDS”)
      • Termites and Other Wood Destroying Insects and Organisms
      • The Subdivision Public Report
      • Title Report or Title Commitment
    • Common Physical Conditions in the Property a Buyer Should Investigate
      • #206 (no title)
      • Deaths and Felonies on the Property
      • Endangered and Threatened Species
      • Flood Plain Status
      • Indoor Environmental Concerns
      • Insurance (Claims History)
      • Other Property Conditions
      • Pests
      • Previous Fire/Flood
      • Property Boundaries
      • Repairs and New Construction
      • Roof
      • Septic and Other On-Site Wastewater Treatment Facilities
      • Sewer
      • Square Footage
      • Swimming Pools and Spas
      • Water/Well Issues
    • Conditions Affecting the Area Surrounding the Property the Buyer Should Investigate
      • City Profile Report
      • Crime Statistics
      • Electromagnetic Fields
      • Environmental Concerns
      • Forested Areas
      • Freeway Construction and Traffic Conditions
      • Military and Public Airports
      • Schools
      • Sex Offenders
      • Superfund Sites
      • Zoning/Planning/Neighborhood Services
    • Other Methods to Obtain Information About a Property
  • Blog
  • Days Inventory
  • Downloads
  • Downloads
  • Frequently Asked Questions
  • Greater Coronado Historic
  • Hiring the Right Agent
  • Home
  • Homepage
  • Homes We’ve Sold
  • How do Real Estate Agents get Paid?
  • jongriffith
  • Link Sharing
  • LOST on ABC Season 4 Finale Poetry Party
  • LOST Season 5 Premiere Poems
  • Market Statistics
    • Market Data for All of ARMLS
  • Mashup
  • MLS Search
  • Mortgage Calculator
  • My Account
  • My Account
  • My Listings
  • My Listings
  • NextDoor Neighborhood Report
  • No Access
  • Obtaining a New Loan
  • On Fitness
  • On Money
  • On Music
  • On Nutrition
  • On Real Estate
  • On Real Estate
  • On Triathlons
  • Online Store
  • Outdoor Living
    • Phoenix Area Hiking and Cycling Trails
  • Page Full of Miscellaneous Things
  • Products Page
    • Transaction Results
    • Verify your Order
    • Your Account
  • Properties
  • Purchase Contract
  • Questions
  • Questions
  • Rates
  • Request a Showing
  • Sample Documents
  • School Matters
  • Schools
    • Arizona AIMS Testing
  • Scottsdale Listings
  • Scottsdale Listings
  • Search Results
  • Sell A Home
    • Marketing Strategy
  • Sell Our House
  • Seller’s Market
  • Selling Short
  • Services
  • Setting the Right Price
  • Shop
  • Shop Product List
  • Short Sale Seller Advisory
    • Before Proceeding With A Short Sale
    • What is a Short Sale?
  • Site Introduction
  • Social Stream
  • Supply and Demand: X Marks the Spot
  • Test
  • Testimonial
  • Testimonials
  • TEsting
  • Testing Full Page
  • Thank You!
  • Thanks!
  • The Creativity of LOST Addicts
  • The Dry Rub
  • The Purchase Contract
  • The Volleygirls Shenanigans
  • Thoughts on Postmate Tips
  • Title
  • Understanding Pool Barrier Laws
  • Videos
  • Ways to Contact
  • Website Consulting
  • Website Hosting Sign-Up
  • Websites for REALTORS
  • What is a Buyer’s Agent?
  • What is a Listing Agent?
  • What is a Real Estate Agent?
  • What is a REALTOR?
  • What Is Entrecard?
  • What’s YOUR Home Worth?
  • Why Use a REALTOR?
  • Work
  • Worship Songs
  • Your Home’s Value

Copyright © 2025 · AgentPress Pro Theme on Genesis Framework · WordPress · Log in