• Home
  • About
  • Ways to Contact: 480-463-4062

A Griffith Listing

Real Estate Services by Jon Griffith

You are here: Home / Archives for average

Property Appreciation Over the Past 14 Years

February 5, 2015 by admin

California_home_Prices

We all know that we experienced what economists would call an “anomaly” between 2004 and 2011, and as a result, thousands of people who were adversely affected by it have developed a particular point of view concerning the value of real estate and it’s viability as an investment.  Remember that time?  Prices shot through the roof, then the whole market “crashed.”

Savvy investors understand that their wealth is built over time, and strange occurrences in the market can be averaged over time to reflect common, long-term patterns.

You may often hear from real estate agents that the average rate of appreciation in the Greater Phoenix Metro Area ranges between 4-7% annually.  That doesn’t apply in every area of the valley, but that’s why they call it an average.

Appreciation is calculated year over year using a rather complicated formula.  Determine a single year’s appreciation is simple, but in order to figure out a pattern of growth over a long period of time dating back many years, this formula must be applied.

A Sampling of One Area of Scottsdale

The area I’ve chosen to highlight lies between Hayden Road and Pima Road, South of McDonald, and North of Chaparral Road.  It contains approximately 2,636 parcels according to the tax records, which are public.

In this area, from the year 2000 through the end of 2014, there were 1,132 closed sales recorded in the Arizona MLS, starting with an average price per square foot in the year 2000 of $87.16 through a final average price per square foot of $172.13 in 2014.

Remember, individual home values should not be calculated based solely on price per square foot.  There are many variables that will improve or hurt the value of an individual home.

Through the mortgage crisis, the highest average $/Foot was in November of 2005 at $223.00, but despite the massive bubble that we all lived through, over the past 14 years, the average rate of real estate appreciation rounds out at 4.98% annually.

Despite the chaos, we have found a relatively normal appreciation rate based on past performance.  This is an important number because it is the number any investor would use to determine what the potential future value of a home might be worth (sans the crystal ball that we all have in our back pocket.)

This average can only be applied to the area that I’ve sampled.  It’s not general.  It’s specific.  It takes time to calculate this information, but it’s important to know what to expect when you compare the value of your home to the current rate of inflation.

Your investment in real estate starts with your equity in the property you own.  Whether you pay cash for a property and own 100% of the home or you make payments whereby a portion of your payment is added to your equity, you can apply an average rate of appreciation to that equity to forecast what it will be worth in the future.

If there’s an area you’d like to have analyzed, I’ll be happy to do that for you.  Contact me today.

Filed Under: Real Estate Basics Tagged With: appreciation, average, time, values

August Market Wrap Up

September 1, 2008 by admin

August 2008, a mere 3 years since the height of our most recent over-inflated boom, has come to a close.

In August, we saw 5833 properties sell at an average sales price of $254,920. The average asking price on properties that sold in August was $245,818 and it took an average of 113 days for those to sell. Homes currently on the market have been so for approximately 94 days on average.

In the Rental market, we currently see a total of 8,905 properties available for lease. In August, 2030 properties were leased at an average rental asking price of roughly $1300/month.

We currently have 51,807 active listings on the MLS with 42,479 of those being Single Family Detached.  Last Monday, this number was at 43,705, representing a 2.8% decrease in the number of homes on the market.

The average sales price for the week ending 8/31/08 was up 14.79% to $280,430 and the number of homes sold in this same period almost doubled to 2110.  Keep in mind that statistics and business that we see recorded today is a result of market conditions and activity in the past.  That is what makes forecasting so difficult.  We never know what the future results of our current actions will be.

It’s taking about 109 days to sell a home across the MLS.  The average asking price fell slightly from the previous week to $408,001.

Filed Under: Market Updates Tagged With: asking, August, average, features, forecasting, market, price, Rental, statistics, Wrap

Market Statistics as of August 24th, 2008

August 25, 2008 by admin

As of now, we have a total of 43,705 single family detached homes on the market.  Our total number of residential listings is at 52,542.  A total of 1053 properties sold between August 18th and August 24th 2008, which was down from the 1200 that sold the previous week.

The average asking price for this week was $409,037 while the average sales price was $238,943 which was a slight increase over the previous week.  It’s time for the market to correct.  Prices over the next 12 months are expected to increase gradually, but not at the rate that we would normally expect of our real estate economy.

We’re currently

at an average of 112 days on market with roughly 9 1/5 months supply of inventory overall.

Filed Under: Uncategorized Tagged With: August, average, Market Statistics, price

Market Update as of August 18th

August 18, 2008 by admin

As of the beginning of the week we had a total of 54,674 homes for sale, including all residential property types. By the end of the day on Sunday, our levels had dropped 1.6% to 53,767. The average asking price at the beginning of the week was $408,161 which increased less than one percent. Average days on market decreased by 5.1%.

1256 properties were sold over the past week which was 18.6% more than was sold the previous week. Word is getting out. It’s time to buy.

For properties that sold last week, the average asking price actually increased 2.83% over the previous from $241,098 to $247,941. The actual average SOLD price of the 1256 properties that sold last week was $237,968, 1.4% less than the previous week at $241,268. Those properties on average were on the market 116 days.

Filed Under: Market Updates Tagged With: asking, August, average, market, price, property, Recently Sold, Update

Weekly Market Update

August 12, 2008 by admin

As usual, the graphs below, organized by week, outline the activity in the market since the beginning of the year.

Inventory for all of ARMLS stands at 54,114 homes with an average asking price of $411,671. The average sales price over this period was $245,206. The average asking price for properties that sold during the week is actually lower than the sales price.

Homes are selling on average in 101 days. Based on our current inventory and rate of closing, we are looking valleywide at a 9 month inventory on average.

Filed Under: Market Updates Tagged With: activity, ARMLS, asking, average, features, market, price, statistics, valleywide

Another Sold Property: 1028 W. Tremaine

August 1, 2008 by admin

Success is a byproduct of helping others.  Today, the sale of 1028 W. Tremaine closed as expected.  This listing hit the market on June 2nd, received its first offer in 17 days and found its way into escrow within 22 days.  The new homeowners are very pleased with their purchase and I am ecstatic to have a satisfied seller.

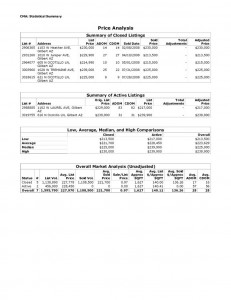
The property was listed at $239,000 and closed today at $225,000, which is 94.1% of what we were asking.  Not bad considering the market conditions.  Gilbert has seen quite a bit of action in the past months, especially in Cayman Square, but just like any other market, price is driving the sale of the homes.

Over the past 6 months, in Cayman Square, single family detached homes with the same square footage as 1028 W. Tremaine have consistently sold at an average of $136.00ft/sq.  In February, we saw 1103 W. Heather sell at a full price offer of $230,000.00 after only 14 days on market.  2 Months later, yet another identical unit sold at $213,500 or 92.9% of the original $229,900 asking price.  On the 1st of May we saw 605 N. Ocotillo go for $10.00 more than the list price at $215,000.  Although listed shortly after our property, 621 N. Ocotillo closed on the 28th of July at a full asking price of $225,000.

There are currently two active listings that have not seen any action, which is unlike the rest, which closed in an average of 17 days.  These are 1102 W. Laurel which has been on the market for 83 days, first listed at $229,000 on May 11th with a recent 5.2% price drop to $217,000 on July 17th, and 616 N. Ocotillo, first listed on July 1st at $239,900.00 which is well above the average sale price in the area.  It will not sell for $239,900.00.

All of these properties are within a stone’s throw to 1028 W. Tremaine, and all of the ones that have sold have one thing in common.  The price was right.

The evidence is before you and will help you determine what your home should be priced at should you be ready to sell.  Now is a fantastic time to buy if you’re planning on expanding or moving up.  Take a look at the following image to see the current Statistical Summary that I have put together.

All of this information has been provided free of charge as a courtesy to you and your neighbors in Cayman Square.  If you are currently considering selling your home, I would love the opportunity to help you.  Call me today!  (602)  312-3262.

Filed Under: Selling a Home Tagged With: average, Cayman Square, Gilbert, market, N. Ocotillo, price, Statistical, W. Heather, W. Laurel, W. Tremaine

  • 1
  • 2
  • Next Page »

Archives

  • September 2023
  • April 2022
  • March 2016
  • January 2016
  • December 2015
  • October 2015
  • June 2015
  • May 2015
  • April 2015
  • February 2015
  • January 2015
  • July 2014
  • April 2014
  • March 2014
  • November 2013
  • October 2013
  • September 2013
  • August 2013
  • May 2013
  • March 2013
  • February 2013
  • July 2012
  • March 2012
  • December 2011
  • December 2010
  • April 2010
  • March 2010
  • February 2010
  • January 2010
  • December 2009
  • November 2009
  • September 2009
  • August 2009
  • June 2009
  • April 2009
  • March 2009
  • February 2009
  • January 2009
  • December 2008
  • November 2008
  • October 2008
  • September 2008
  • August 2008
  • July 2008
  • June 2008
  • May 2008
  • April 2008
  • March 2008
  • February 2008
  • January 2008
  • December 2007
  • November 2007
  • October 2007
  • September 2007
  • August 2007
  • July 2007
  • April 2007
  • March 2007
  • November 2006
  • August 2006
  • June 2006
  • September 2005
  • August 2005

Test

  • About
  • Affordability Calculator
  • Arizona Department of Real Estate Buyer Advisory
    • Additional Information
    • Common Documents a Buyer Should Review
      • Affidavit of Disclosure
      • County Assessors/Tax Records
      • Covenants, Conditions and Restrictions (“CC&R’s”)
      • HOA Disclosures
      • Home Warranty Policy
      • Homeowner’s Association (“HOA”) Governing Documents
      • Lead Based Paint Addendum
      • Loan Documents
      • MLS Printout
      • Professional Home Inspection Report
      • Purchase Contract
      • Seller’s Property Disclosure Statement (“SPDS”)
      • Termites and Other Wood Destroying Insects and Organisms
      • The Subdivision Public Report
      • Title Report or Title Commitment
    • Common Physical Conditions in the Property a Buyer Should Investigate
      • #206 (no title)
      • Deaths and Felonies on the Property
      • Endangered and Threatened Species
      • Flood Plain Status
      • Indoor Environmental Concerns
      • Insurance (Claims History)
      • Other Property Conditions
      • Pests
      • Previous Fire/Flood
      • Property Boundaries
      • Repairs and New Construction
      • Roof
      • Septic and Other On-Site Wastewater Treatment Facilities
      • Sewer
      • Square Footage
      • Swimming Pools and Spas
      • Water/Well Issues
    • Conditions Affecting the Area Surrounding the Property the Buyer Should Investigate
      • City Profile Report
      • Crime Statistics
      • Electromagnetic Fields
      • Environmental Concerns
      • Forested Areas
      • Freeway Construction and Traffic Conditions
      • Military and Public Airports
      • Schools
      • Sex Offenders
      • Superfund Sites
      • Zoning/Planning/Neighborhood Services
    • Other Methods to Obtain Information About a Property
  • Blog
  • Days Inventory
  • Downloads
  • Downloads
  • Frequently Asked Questions
  • Greater Coronado Historic
  • Hiring the Right Agent
  • Home
  • Homepage
  • Homes We’ve Sold
  • How do Real Estate Agents get Paid?
  • jongriffith
  • Link Sharing
  • LOST on ABC Season 4 Finale Poetry Party
  • LOST Season 5 Premiere Poems
  • Market Statistics
    • Market Data for All of ARMLS
  • Mashup
  • MLS Search
  • Mortgage Calculator
  • My Account
  • My Account
  • My Listings
  • My Listings
  • NextDoor Neighborhood Report
  • No Access
  • Obtaining a New Loan
  • On Fitness
  • On Money
  • On Music
  • On Nutrition
  • On Real Estate
  • On Real Estate
  • On Triathlons
  • Online Store
  • Outdoor Living
    • Phoenix Area Hiking and Cycling Trails
  • Page Full of Miscellaneous Things
  • Products Page
    • Transaction Results
    • Verify your Order
    • Your Account
  • Properties
  • Purchase Contract
  • Questions
  • Questions
  • Rates
  • Request a Showing
  • Sample Documents
  • School Matters
  • Schools
    • Arizona AIMS Testing
  • Scottsdale Listings
  • Scottsdale Listings
  • Search Results
  • Sell A Home
    • Marketing Strategy
  • Sell Our House
  • Seller’s Market
  • Selling Short
  • Services
  • Setting the Right Price
  • Shop
  • Shop Product List
  • Short Sale Seller Advisory
    • Before Proceeding With A Short Sale
    • What is a Short Sale?
  • Site Introduction
  • Social Stream
  • Supply and Demand: X Marks the Spot
  • Test
  • Testimonial
  • Testimonials
  • TEsting
  • Testing Full Page
  • Thank You!
  • Thanks!
  • The Creativity of LOST Addicts
  • The Dry Rub
  • The Purchase Contract
  • The Volleygirls Shenanigans
  • Thoughts on Postmate Tips
  • Title
  • Understanding Pool Barrier Laws
  • Videos
  • Ways to Contact
  • Website Consulting
  • Website Hosting Sign-Up
  • Websites for REALTORS
  • What is a Buyer’s Agent?
  • What is a Listing Agent?
  • What is a Real Estate Agent?
  • What is a REALTOR?
  • What Is Entrecard?
  • What’s YOUR Home Worth?
  • Why Use a REALTOR?
  • Work
  • Worship Songs
  • Your Home’s Value

Copyright © 2025 · AgentPress Pro Theme on Genesis Framework · WordPress · Log in